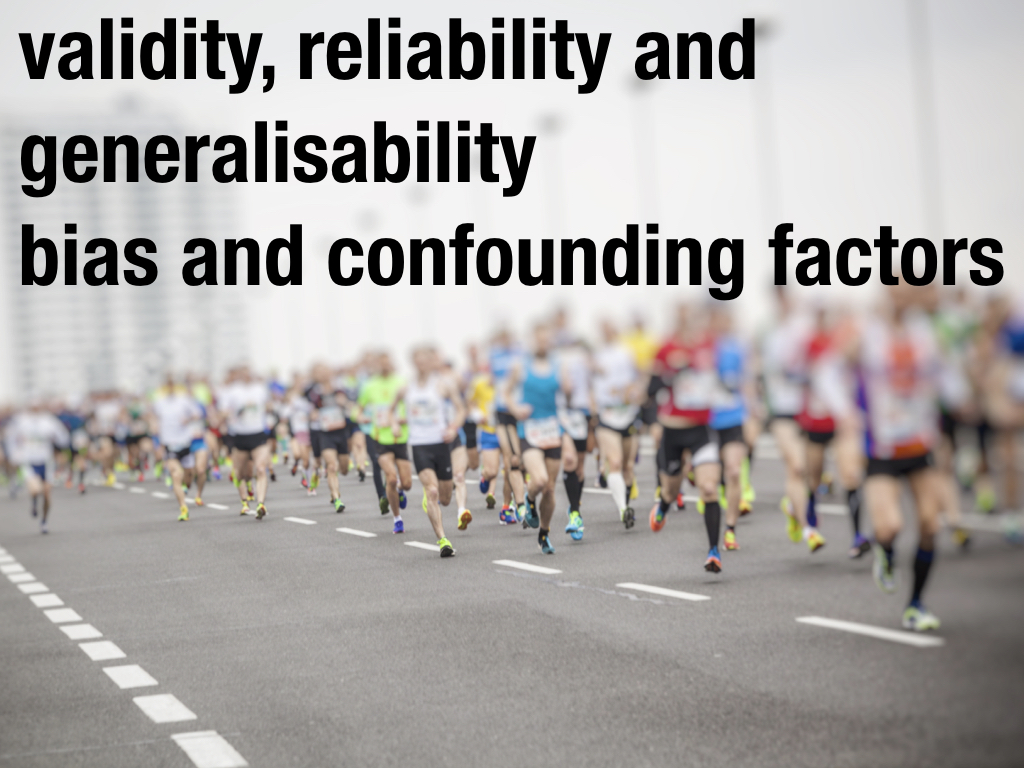
Session Twelve: Validity, Reliability and Generalisability, Bias and Confounding Variables
This episode is a live recording of the eleventh session of #UnblindingResearch held in DREEAM 17th April 2019. The group work has been removed for the sake of brevity.


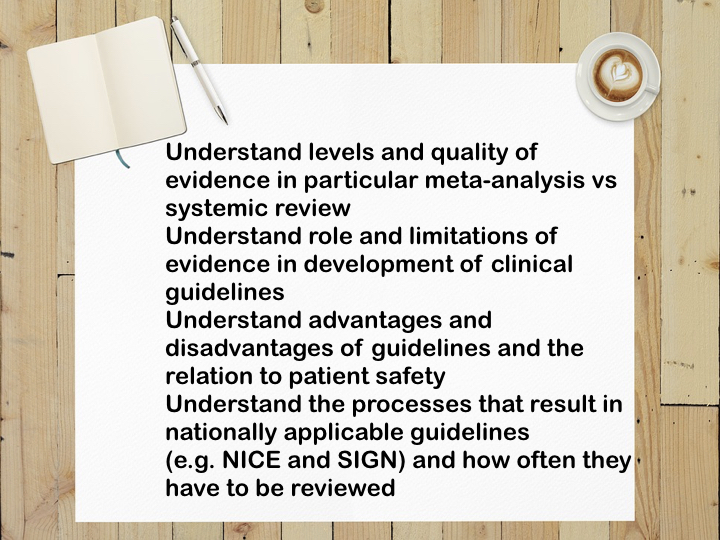
Here is the #TakeVisually for this episode:
This session uses the example of DREEAM alumnus James Pratt who completed the Great North Run last year in 1 hour 39 minutes! This was used as a way of explaining some definitions.
Accuracy, Precision and Reliability
Accuracy describes how close a device’s measurement is to the true value. So when the stopwatch went off as James crossed the finish line the accuracy of the recorded time is how close it is the time he actually took running.
Precision and reliability are very similar.
Say James runs the Great North Run a few times and each time at the same speed. He’d get a series of finish times. Precision describes how close together those times are. If James runs the same race at a similar speed he would expect precise times.
In this session we asked the audience to draw two dots on the nose of a photo of our head of service whilst blindfolded to show the difference between accuracy and precision.

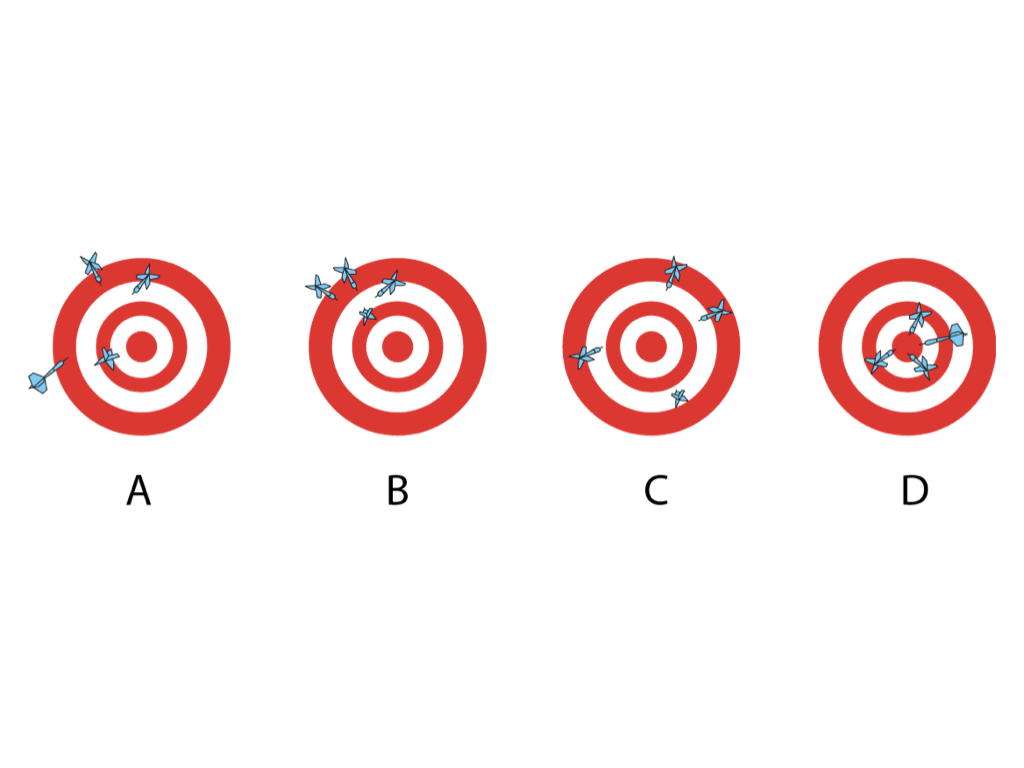
In Dartboard A the thrower has poor accuracy as there is variation between the distances of the darts from the bullseye and poor precision as the darts are not close together
In B the precision is good as the darts are close together but accuracy is poor
In C the accuracy is good as the darts are of a similar distance from the bullseye but precision is poor
In D the darts are both accurate and precise
On the other hand reliability describes whether the race and stopwatch themselves produce consistent results given similar conditions. So if James runs the Great North Run at the same speed he will get consistent times if the race is being measured reliably.
There are many different types of reliability. If James runs the race twice at the same speed he’d want the same outcome. This is test-retest reliability. If James runs the race several times and each time a different person is timing him he’d want them to be measuring to the same accuracy. This is inter-rater reliability.
In our session we asked two of our audience members to draw our head of service as a demonstration of the importance of reliability.
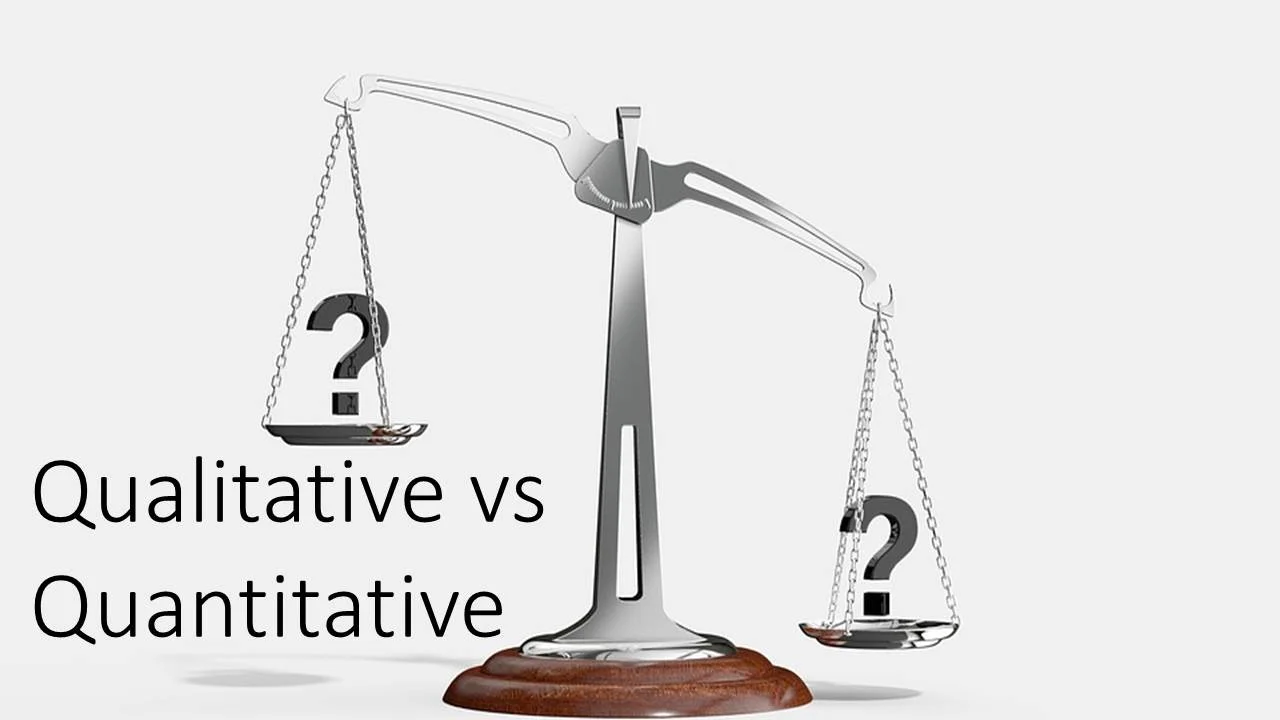
Validity and Generalisability
A study’s internal validity reflects the author’s and reviewer’s confidence that bias has been minimised and eliminated. Evaluating the study methodology for sources of bias allows us to assess the study’s internal validity. The highest validity studies often are those looking at a specific intervention in ideal circumstances. As a result high internal validity often comes at the cost of generalisability. Levels of evidence are based on how high the internal validity is.
The key question to ask when thinking about external validity or generalisability is ‘what are the differences between the source population (the population from which the study population originated) and the study population (those included in the study)? A generalisable study is one where the findings can be applied to other groups or populations. Loose inclusion criteria are often used in studies with high external validity but this may compromise the external validity.
The ideal scenario would a study with randomised patients and blinded researchers collecting and analysing the date (high internal validity) and using minimal exclusion criteria so the source and study populations are closely related (high external validity).
There are objective models to quantify both external and internal validity. Randomised control trials must be rigorously evaluated. The CONSORT statement provides a concise 22-point checklist for authors reporting the results of RCTs. Conforming to the CONSORT checklist provides adequate information for anyone reading the study to understand its methodology.
Fragility Index
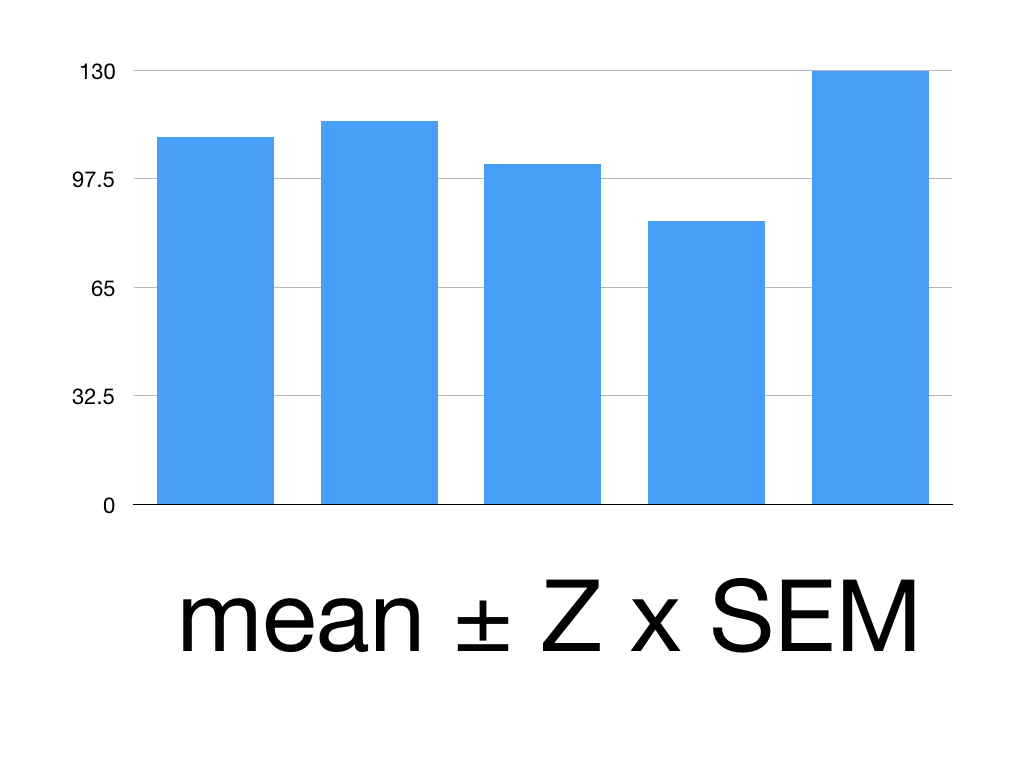
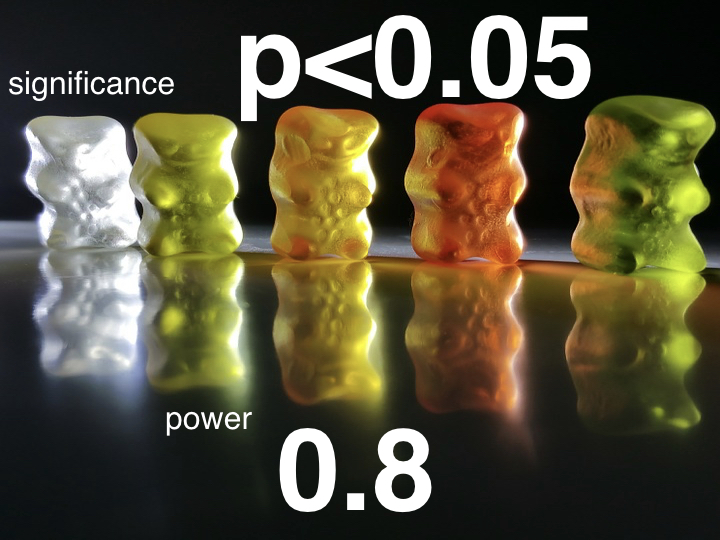
In a previous session we talked about levels of evidence and significance. Fragility Index looks at how many events would need to change for the p value to go >0.05 (how many events need to change for the outcome to no long be significant). The lower the Fragility Index the more fragile the study is. This is important because a lot of clinical trials actually turn out to be very fragile.
A Fragility Index calculator is available at http://www.fragilityindex.com/
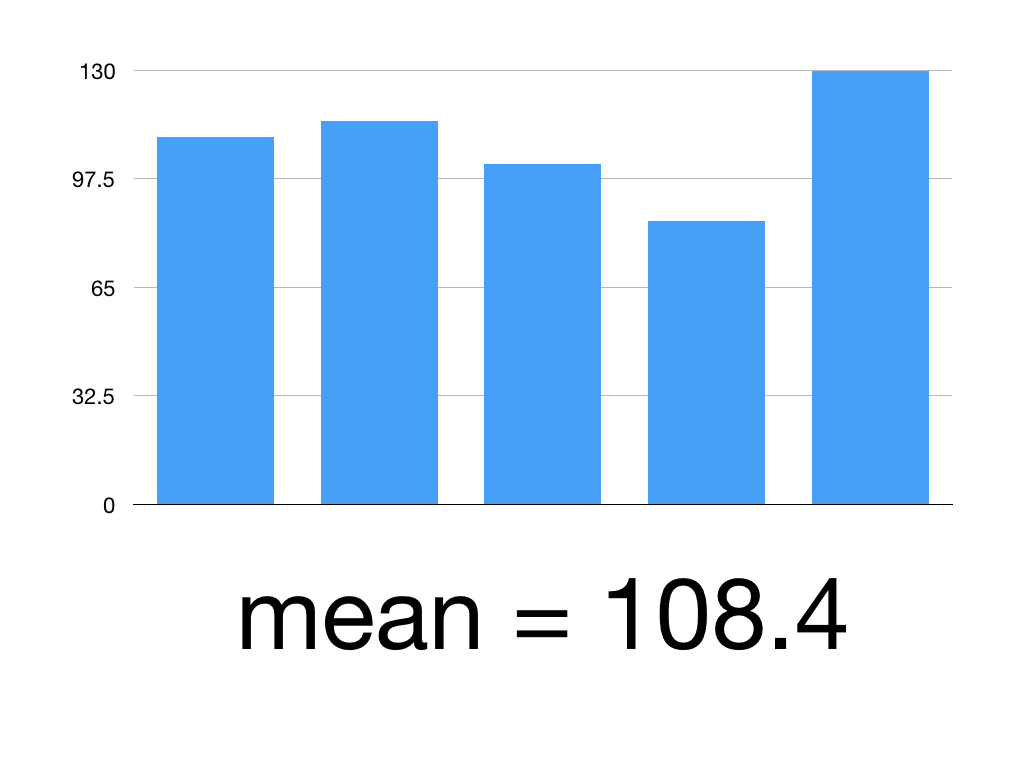
Say you’ve studied 100 people on new treatment vs 100 on the old treatment
Intervention mortality was 7 whilst control mortality was 20
Using the above calculator we find we’d only need 3 events to change for our trial to no longer be significant
More on fragility index can be found at https://lifeinthefastlane.com/ccc/fragility-index
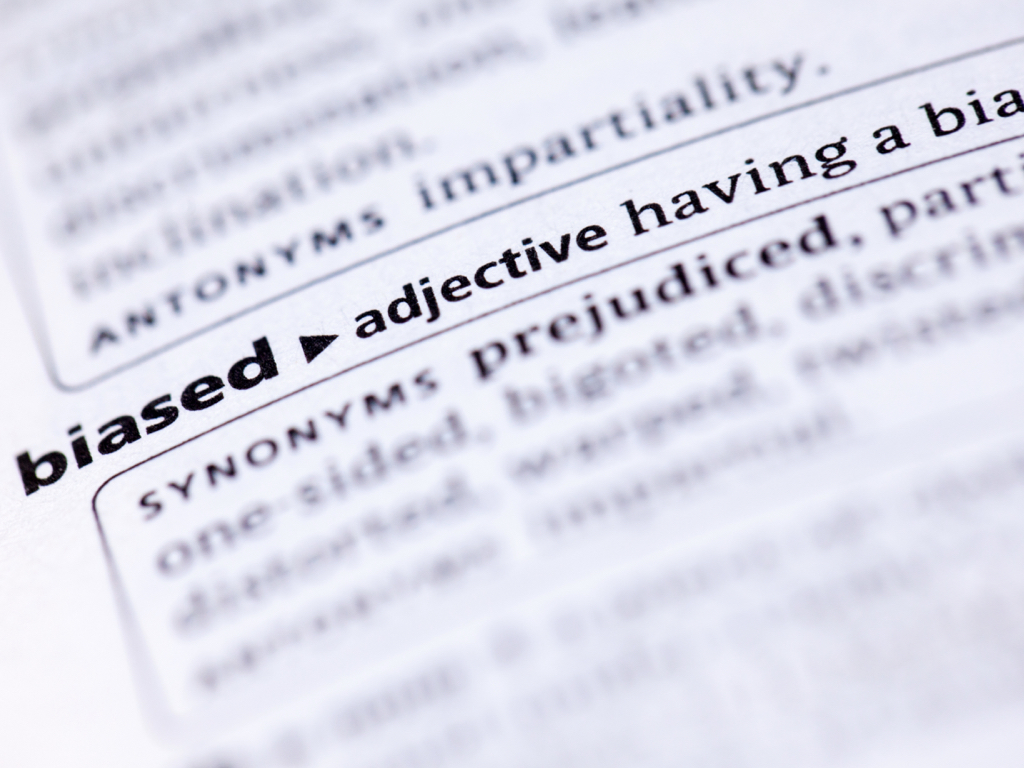
Bias
Bias is any tendency which prevents unprejudiced consideration of a question. Evidence based medicine (EBM) arose in the early 1980s as a way of making Medicine more data-driven and literature based. It is important to consider bias throughout the research process; before, during and after the trial. While random error decreases as our sample increases bias is independent of both sample size and statistical significance.
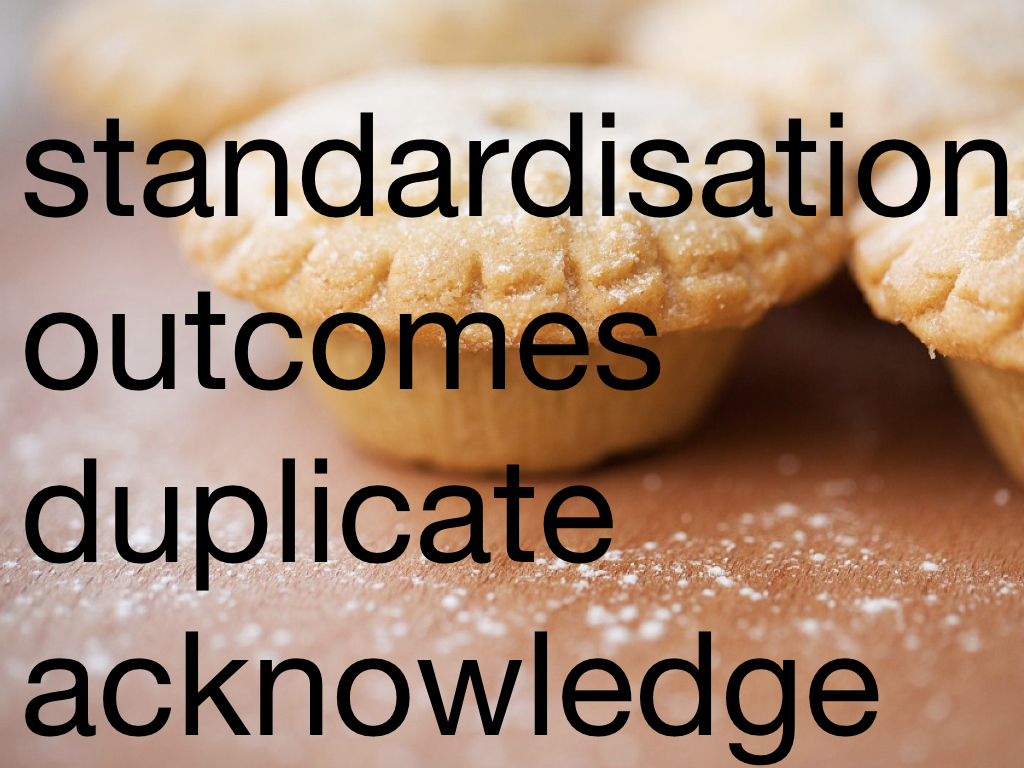
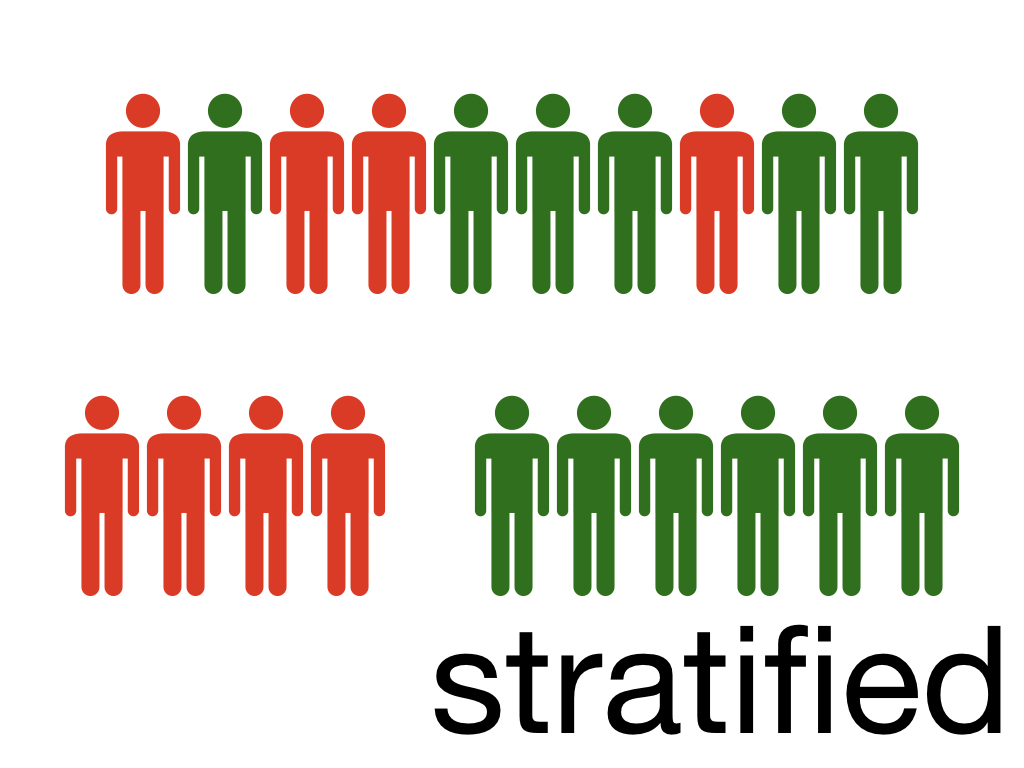
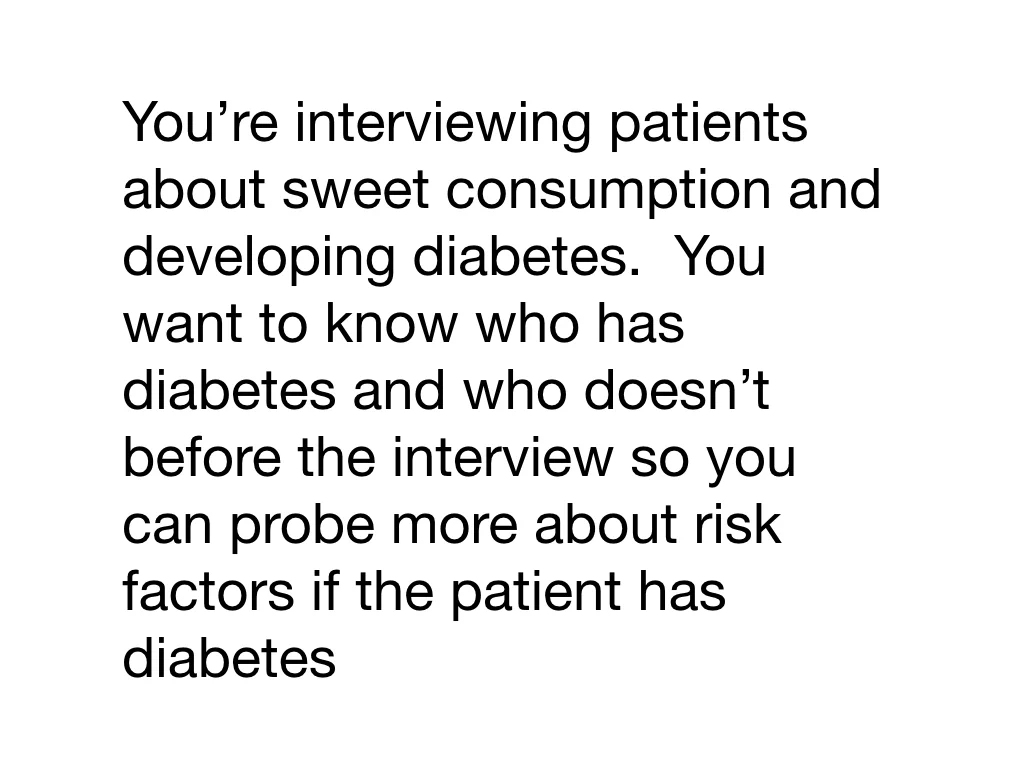
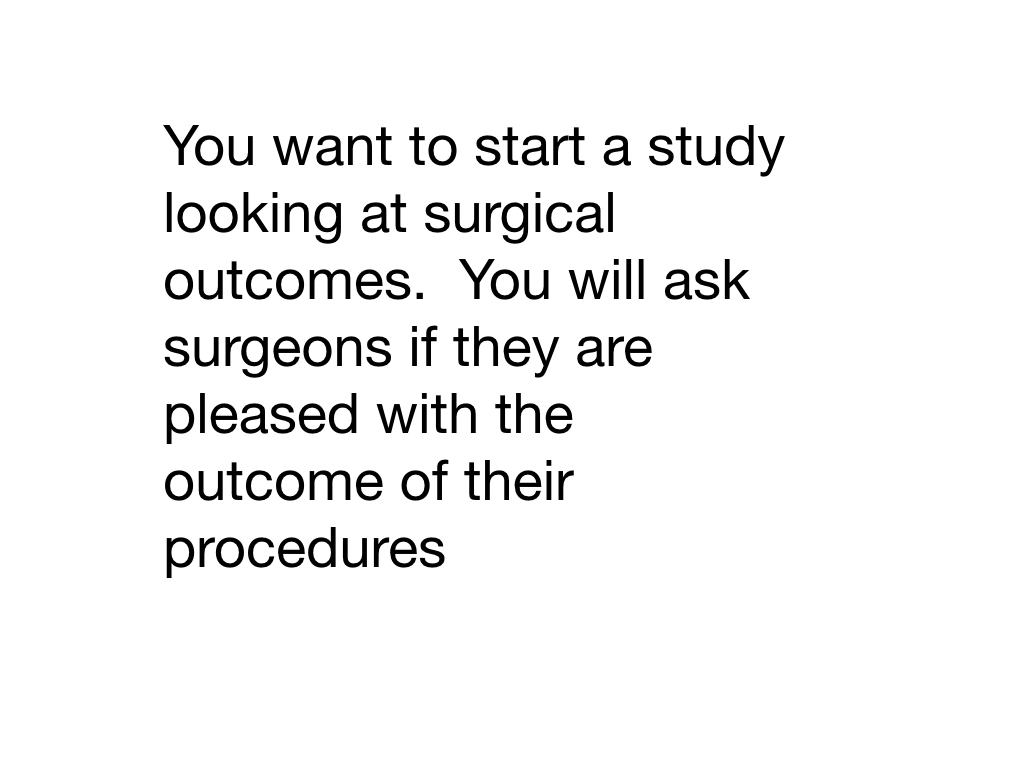
Pre-trial bias is created by errors in our study design and the recruitment of patients. Think about how standardised the measurements are – if there is an interview or questionnaire is everyone on your research team going to use it in the same way? Blinding is not always possible – in surgical studies for example – so you could have different people assessing the outcome than those who assessed the exposure. Different parts of the team can be blinded. Selection bias is particularly risky in case-control and retrospective cohort studies where the outcome is already known as the criteria for inclusion in different groups might be radically different. Prospective studies, especially randomised-control trials, are less prone to selection bias. Channelling bias can be seen when a subject’s health or prognostic factors dictates the cohort they are placed in. We might see this in a surgical study when younger, healthier patients are placed in the surgery cohort while older, less healthy patients aren’t.
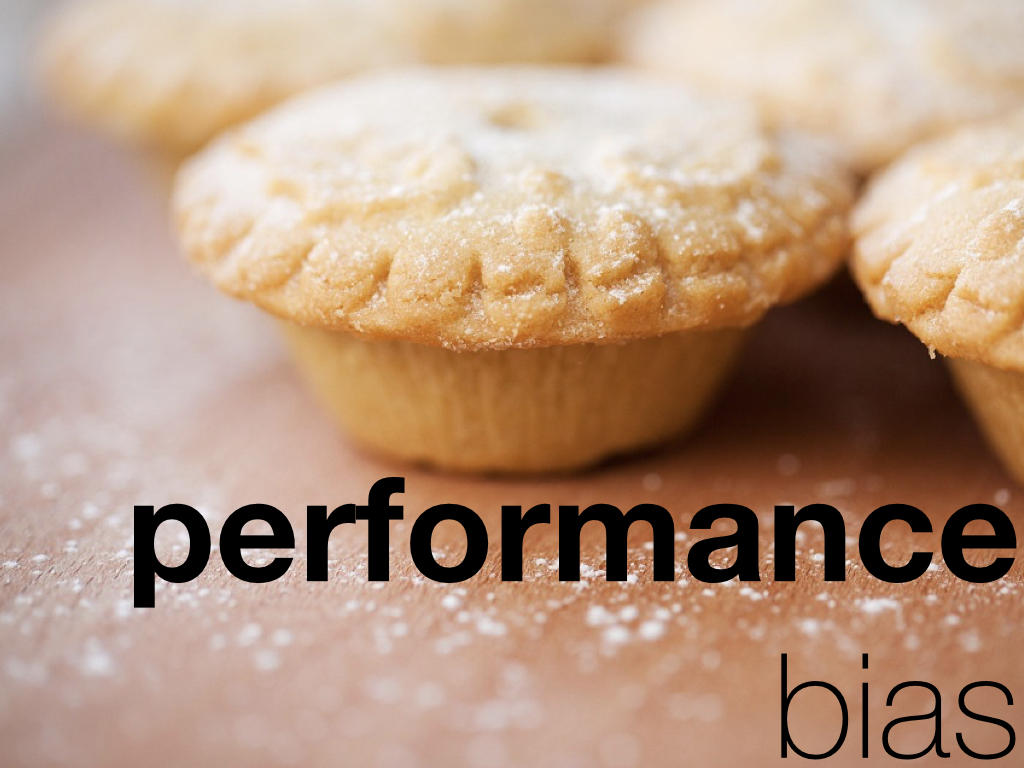
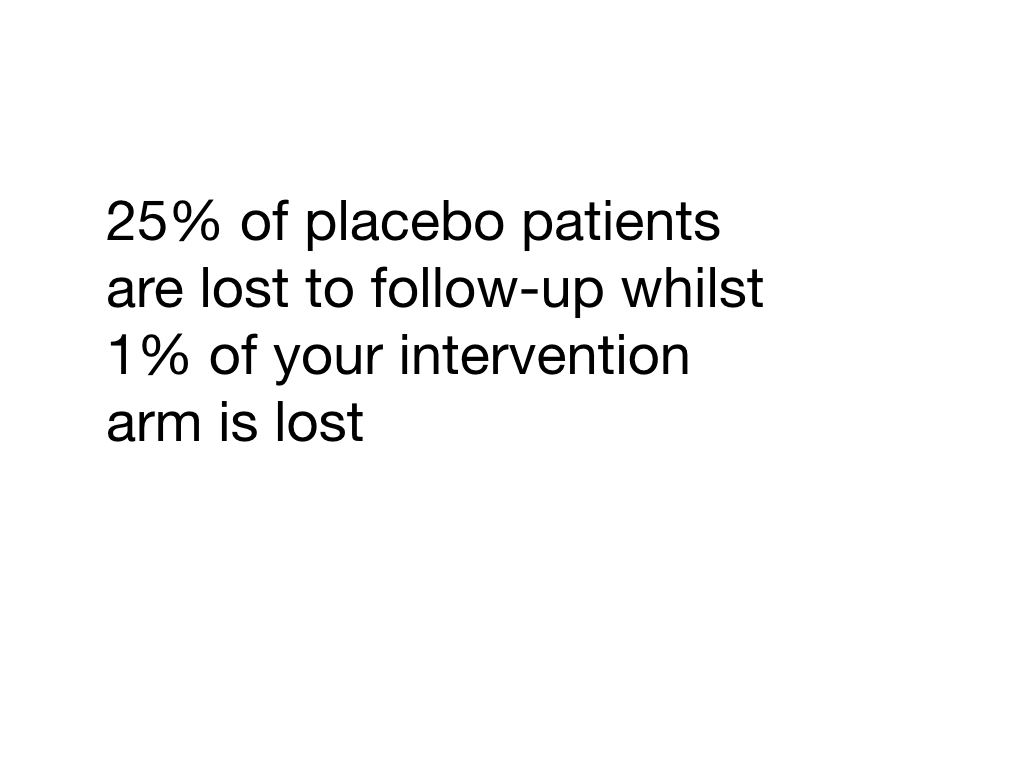
Information bias is a blanket term for bias occurring in the measurement of an exposure or outcome and can occur throughout the data collection process. Data collection can change depending on who is collecting it (interviewer bias). Historic controls could be used (chronology bias) or there could be problems recalling information or memory may cloud recollection (recall bias). Patients can be lost to follow-up and so lost from the study. These individuals may be fundamentally different to those retained in the study (transfer bias). There may be problems defining the exposure or properly identifying the outcome (misclassification of exposure/outcome). If a process (say surgery) has a lot of variation technically or in terms of seniority/experience this may affect the outcome (performance bias).
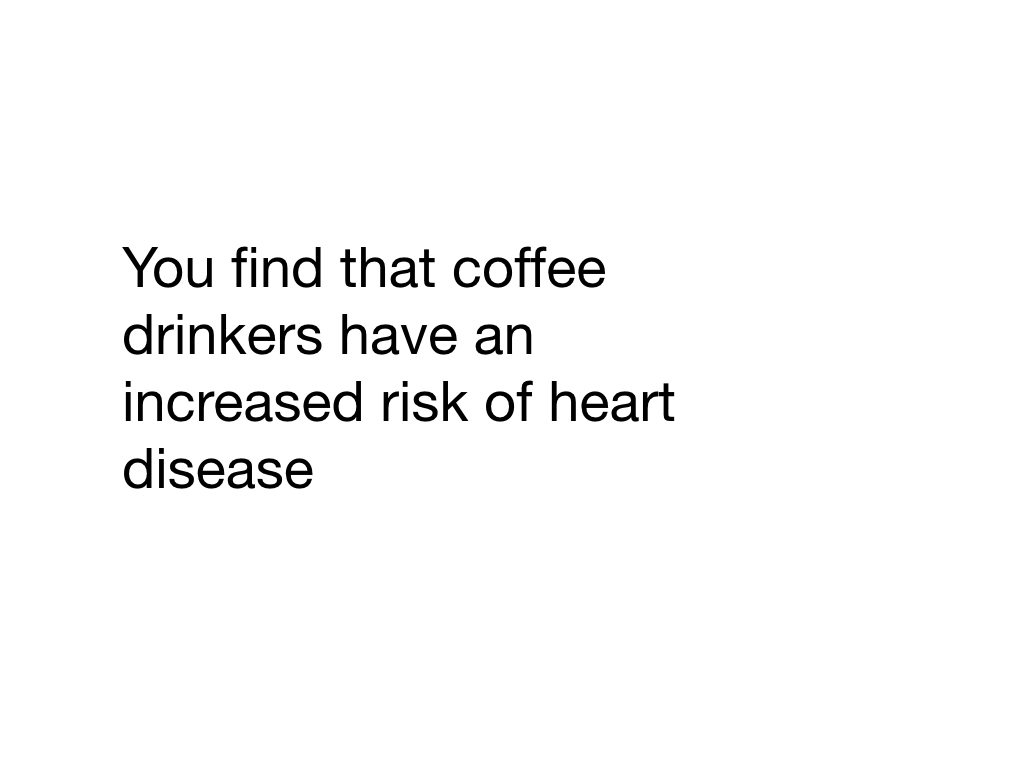
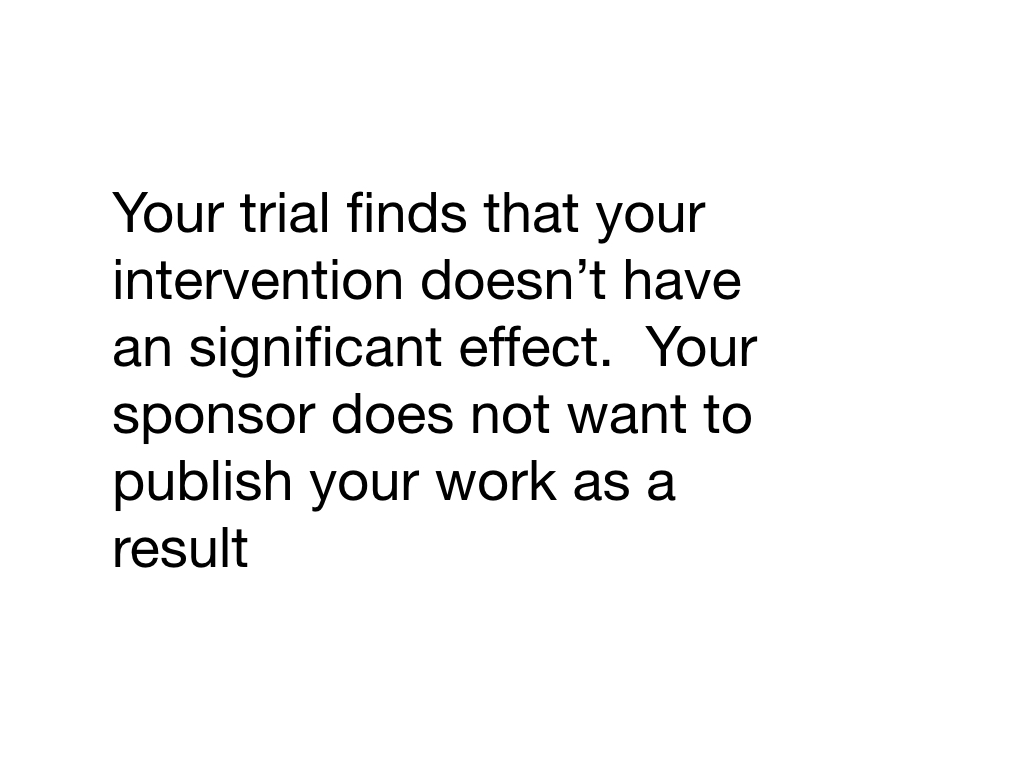
Bias after a trial is concluded occurs during data analysis or publication. There’s the desire to only publish positive or favourable outcomes (citation bias). There could be a third factor, often associated with our outcome of interest and the exposure, which affects the observed association. This is called confounding. Say you studied coffee drinking and lung cancer and found that those who drank more coffee had higher rates of lung cancer. A confounding variable would be smoking (people having a cigarette with their coffee). You’d have to appreciate this when you design your trial.