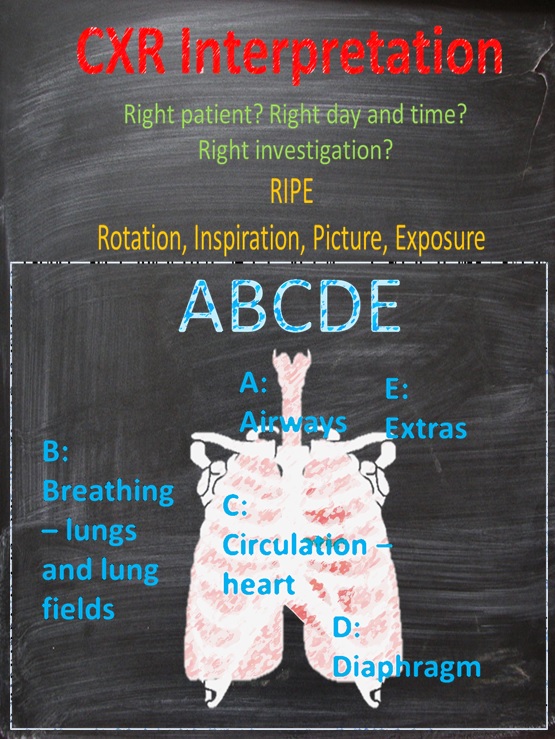
ABCDE of Chest X-Ray - Use the RIPE Approach!

In this podcast Dr. Harry Pick, Respiratory Registrar and Clinical Research Fellow at Nottingham University Hospitals NHS Trust came down to talk us through Chest X-ray Interpretation; a key skill in the Emergency Department!

Harry very kindly gave us a copy of the Powerpoint he uses when he teaches this topic; due to confidentiality reasons these slides don't have X-rays on them but great resources can be found at Radiology Masterclass. Click either side of the pictures to move through them.  

Remember the step by step approach:

Right patient; day and time? - this is key for all investigations.

Is the film AP (anterior to posterior) or PA (posterior to anterior).  This matters for two reasons.  Firstly, an AP film tends to be an portable CXR and so tells you that the patient was sick when it was taken, this may be confirmed by the presence of chest leads, O2 tubes and central lines on the film.  Secondly AP films exaggerate the size of the heart and so you cannot comment on cardiomegaly.  You can on a PA film.  In a healthy individual the heart should be no more than 50% of the thoracic width on a PA film.  If the scapulae are not projected into the chest assume it is a PA film.  It should always say if it is an AP film.   

'RIPE' - Rotation (equal space between medial aspects of clavicles to spinous processes), Inspiration (>7 anterior and 9 posterior ribs, Picture (can you see everything you want to see?) and Exposure (can you see vertebral bodies behind the heart).

Then remember ABCDE - this varies - the Take Visually below follows Airway, Breathing, Circulation, Diaphragm and Everything else.

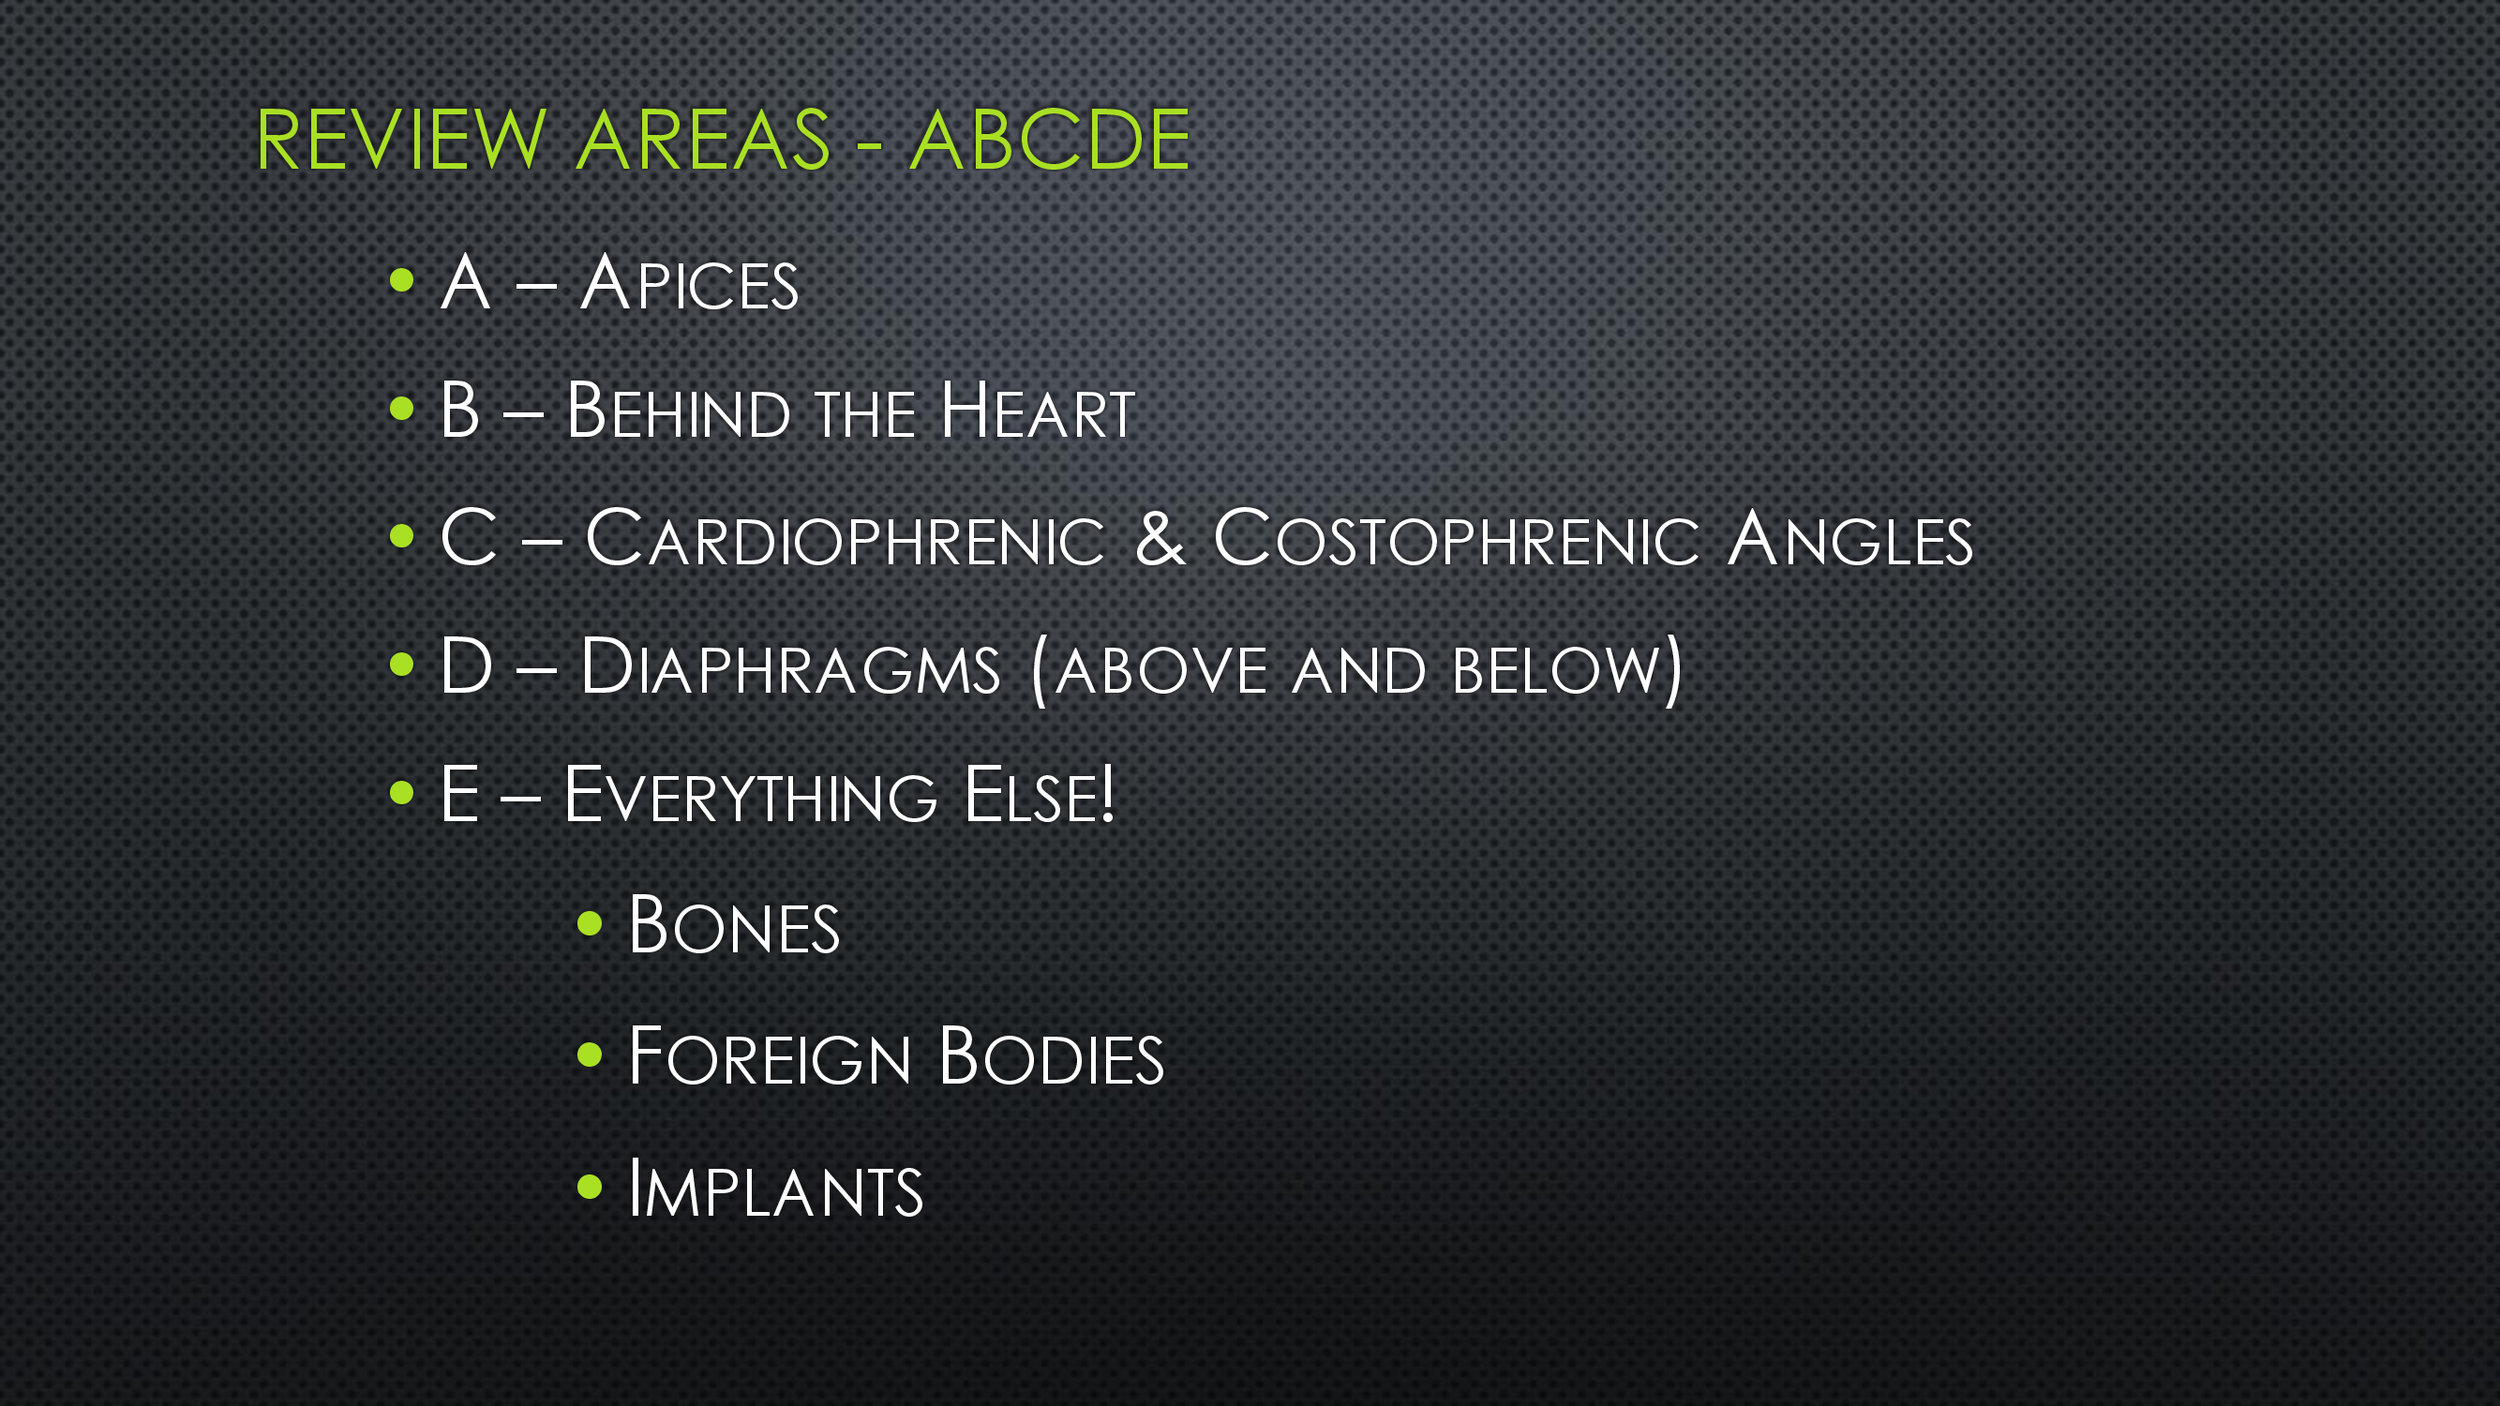
Harry's ABCDE covers the same things but in a different order - Apices, Behind the heart, Cardiophrenic and Costophrenic angles, Diaphragms - above and below and Everything else. 

Don't forget to compare the chest x-ray with any previous ones (very easy on most programmes) - this is very useful to assess any acute changes.  Older x-rays should also have been reported which will help your interpretation!  

As you can see there's a subtle variation, make sure you find a method that works for you!  

Here is the Take Visually for this podcast.  

cxr.jpg

Geeky Medics have a great page on the subject as well.

How I Learned to Stop Worrying and Love the ECG

ECGs are an essential part of Medicine and unavoidable as a student and junior doctor.  I remember being bleeped as an F2 on call by an Orthopaedic surgeon to read the ECG of one of his patients as he had forgotten...ECGs are definitely a case of improving confidence and knowledge through repeated practice and exposure.

Once again I cannot recommend Life in the Fast Lane enough for incredible resources when it comes to ECG.

Here is our video on how to take an ECG:

In the latest Take Aurally podcast I discuss an approach to ECG interpretation and in this blog I've enlisted the help of Albert Einstein to help me through.  You can find the tool for making this meme here.

Remember, it doesn't matter how the patient describes their chest pain as an ''ache'', ''twinge'', 'indigestion''...whatever chest pain is chest pain and needs an ECG.   

Slide8.JPG

This step is vital, is the ECG in your hands from the right patient, right day and time?  Also, get an idea about the presentation behind the ECG, do they have pain, shortness of breath, collapse or palpitations?

Slide9.JPG

Only in certain BBC television dramas (cough, Casualty, cough) does a flat line on an ECG mean death.  In real life it means that the ECG lead in question is not connected properly and needs reattaching.  Make sure you can see electrical activity in all 12 leads.  

Slide11.JPG

Most ECGs will tell you this anyway but it is important to be able to work this out for yourself.  In a regular rhythm (equal distance between all R waves) you can count the number of large squares between each R wave and divide 300 by this number.  Alternatively you can count the number of beats on the rhythm strip and times this by 6.  

There's about 3.5 big squares between each R wave here.  Using 300/3.5 gives a heart rate of 86.

Alternatively, there are 15 beats on the rhythm strip,  15 x 6 = 90.

Slide13.JPG

This is all about looking at the R-R distance for successive beats.  This can be marked on a separate piece of paper and moved along to confirm.

If the rhythm is irregular you can then also see if it's regularly irregular or irregularly irregular 

By looking at successive R-R distances we can see that this ECG shows a regular rhythm.

The QRS complex should be 3 small squares wide.  This is important for two reasons.  In tachycardia the duration of QRS points to the diagnosis and management as shown in the Resus Council flowchart below.  In normal rates it also points to a bundle branch block.

Slide16.JPG

Taken from Resus Council UK

My method for working out LBBB or RBBB...without a William or Marrow in sight

P waves indicate sinus rhythm.  PR interval should be 3-5 small squares.  

First degree heart block: PR interval is prolonged and remains the same (occurs between SA and AV node)

Second degree heart block: Mobitz 1 - the PR interval gets longer and longer until there is a dropped QRS and the cycle starts again.  (Occurs in the AV node) Mobtiz 2 - the PR interval is long, stays the same length but there is a dropped QRS in a ratio: 3-1, 4-1 etc (occurs after AV node in bundle of His/Purkinje fibres)

Third (complete) heart block: No relationship between P waves and QRS (occurs anywhere from AV node down)

PR interval could also be shortened as seen in WPW.

Slide26.JPG

Axis is all about the general spread of electrical activity across the heart.  

Here I look at leads I and II.  Usually the R waves should both be positive as here:

In left axis deviation the R wave in II is now negative so they pointing away from each other or 'leaving'.

Leaving = Left Axis Deviation

This is a sign of ischaemia 

Here the R wave is I is negative so they reaching for each other.

Reaching = Right axis deviation

RAD is a sign of RVH

This is important to notice ST elevation - STEMI (2mm or more in 2 or more chest leads or 1mm or more in 2 or more limb leads) or ST depression or T wave inversion - can be seen in NSTEMI

Be wary if you see regional ST depression - this could be reciprocal depression so make sure you look for ST elevation in other leads

Remember to look at the J point - the point where the S wave joins the ST segment - this can be raised in young, thin patients giving the appearance of ST elevation.  This is caused benign early repolarisation or 'high take off'

T waves can also point to other conditions - the tall T waves in hyperkalaemia; biphasic T waves in hypokalaemia or ischaemia; or flattened in ischaemia or electrolyte imbalance.

U waves, small deflections after the T wave can be seen in a number of conditions; hypokalaemia, hypothermia or antiarrhythmic therapy like digoxin

Slide47.JPG

My colleague James Pratt has made an excellent e-Learning package on ECG interpretation which can be found here

Geeky Medics have a great page on ECG interpretation here

ECGs courtesy of the amazing Life in the Fast Lane

You can hear our ECG Interpretation podcast here: