How I Learned to Stop Worrying and Love the ECG
ECGs are an essential part of Medicine and unavoidable as a student and junior doctor. I remember being bleeped as an F2 on call by an Orthopaedic surgeon to read the ECG of one of his patients as he had forgotten...ECGs are definitely a case of improving confidence and knowledge through repeated practice and exposure.
Once again I cannot recommend Life in the Fast Lane enough for incredible resources when it comes to ECG.
Here is our video on how to take an ECG:
In the latest Take Aurally podcast I discuss an approach to ECG interpretation and in this blog I've enlisted the help of Albert Einstein to help me through. You can find the tool for making this meme here.
Remember, it doesn't matter how the patient describes their chest pain as an ''ache'', ''twinge'', 'indigestion''...whatever chest pain is chest pain and needs an ECG.

This step is vital, is the ECG in your hands from the right patient, right day and time? Also, get an idea about the presentation behind the ECG, do they have pain, shortness of breath, collapse or palpitations?
Only in certain BBC television dramas (cough, Casualty, cough) does a flat line on an ECG mean death. In real life it means that the ECG lead in question is not connected properly and needs reattaching. Make sure you can see electrical activity in all 12 leads.
Most ECGs will tell you this anyway but it is important to be able to work this out for yourself. In a regular rhythm (equal distance between all R waves) you can count the number of large squares between each R wave and divide 300 by this number. Alternatively you can count the number of beats on the rhythm strip and times this by 6.
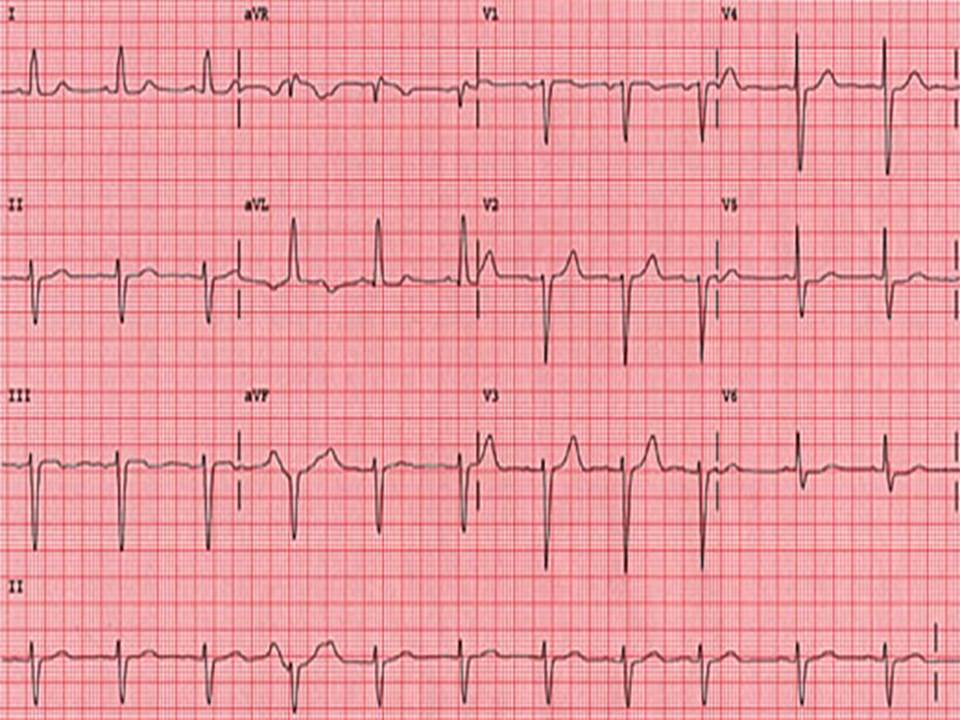
There's about 3.5 big squares between each R wave here. Using 300/3.5 gives a heart rate of 86.
Alternatively, there are 15 beats on the rhythm strip, 15 x 6 = 90.
This is all about looking at the R-R distance for successive beats. This can be marked on a separate piece of paper and moved along to confirm.
If the rhythm is irregular you can then also see if it's regularly irregular or irregularly irregular
By looking at successive R-R distances we can see that this ECG shows a regular rhythm.
The QRS complex should be 3 small squares wide. This is important for two reasons. In tachycardia the duration of QRS points to the diagnosis and management as shown in the Resus Council flowchart below. In normal rates it also points to a bundle branch block.

Taken from Resus Council UK
My method for working out LBBB or RBBB...without a William or Marrow in sight
P waves indicate sinus rhythm. PR interval should be 3-5 small squares.
First degree heart block: PR interval is prolonged and remains the same (occurs between SA and AV node)
Second degree heart block: Mobitz 1 - the PR interval gets longer and longer until there is a dropped QRS and the cycle starts again. (Occurs in the AV node) Mobtiz 2 - the PR interval is long, stays the same length but there is a dropped QRS in a ratio: 3-1, 4-1 etc (occurs after AV node in bundle of His/Purkinje fibres)
Third (complete) heart block: No relationship between P waves and QRS (occurs anywhere from AV node down)
PR interval could also be shortened as seen in WPW.

Axis is all about the general spread of electrical activity across the heart.
Here I look at leads I and II. Usually the R waves should both be positive as here:
In left axis deviation the R wave in II is now negative so they pointing away from each other or 'leaving'.
Leaving = Left Axis Deviation
This is a sign of ischaemia

Here the R wave is I is negative so they reaching for each other.
Reaching = Right axis deviation
RAD is a sign of RVH

This is important to notice ST elevation - STEMI (2mm or more in 2 or more chest leads or 1mm or more in 2 or more limb leads) or ST depression or T wave inversion - can be seen in NSTEMI
Be wary if you see regional ST depression - this could be reciprocal depression so make sure you look for ST elevation in other leads
Remember to look at the J point - the point where the S wave joins the ST segment - this can be raised in young, thin patients giving the appearance of ST elevation. This is caused benign early repolarisation or 'high take off'
T waves can also point to other conditions - the tall T waves in hyperkalaemia; biphasic T waves in hypokalaemia or ischaemia; or flattened in ischaemia or electrolyte imbalance.
U waves, small deflections after the T wave can be seen in a number of conditions; hypokalaemia, hypothermia or antiarrhythmic therapy like digoxin